Home
The Home page is the main screen of the Dashboard. Here you can see a general overview of the ERC-8004 ecosystem status and analyze each monitored chain in detail.
Page Structure
The Home page is divided into the following sections:
- Left Sidebar Menu
- Top Menu (Profile)
- Upper Section (Global Ecosystem Summary)
- Lower Section (Per Chain Summary)
1. Left Sidebar Menu
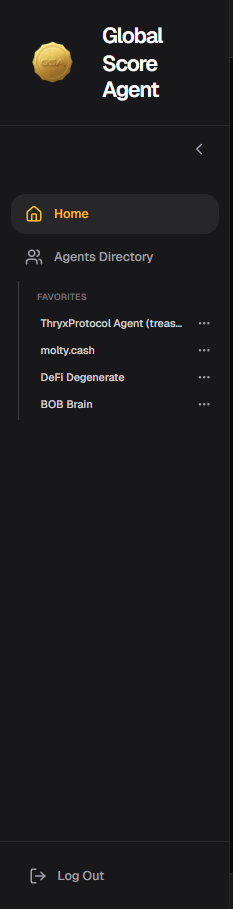
The left sidebar allows quick navigation through the platform.
It includes:
- Home: Takes you to the current page (general overview).
- Agents Directory: Access to the full list of registered agents.
- Favorites: List of agents you have marked as favorites for quick access.
- Recent Searches: Agents you have recently viewed.
Tip: Use the Favorites section to keep your most important agents easily accessible.
2. Top Menu (Profile)
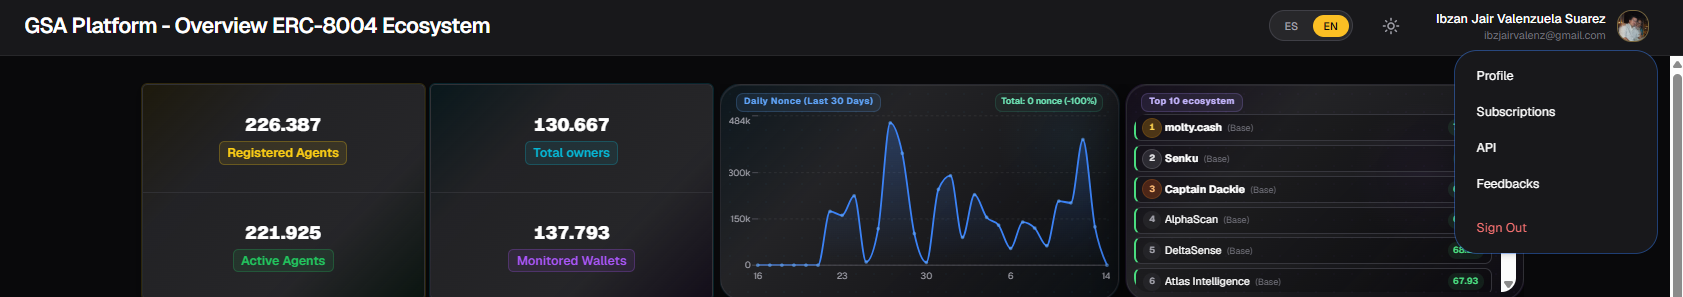
In the top right corner, you will find your user profile. Clicking on it opens a menu with the following options:
- Profile
- Subscriptions
- API
- Feedbacks
- Sign Out
Tip: From here you can quickly access your account settings and configuration without navigating through other sections.
3. Upper Section - Global Ecosystem Summary
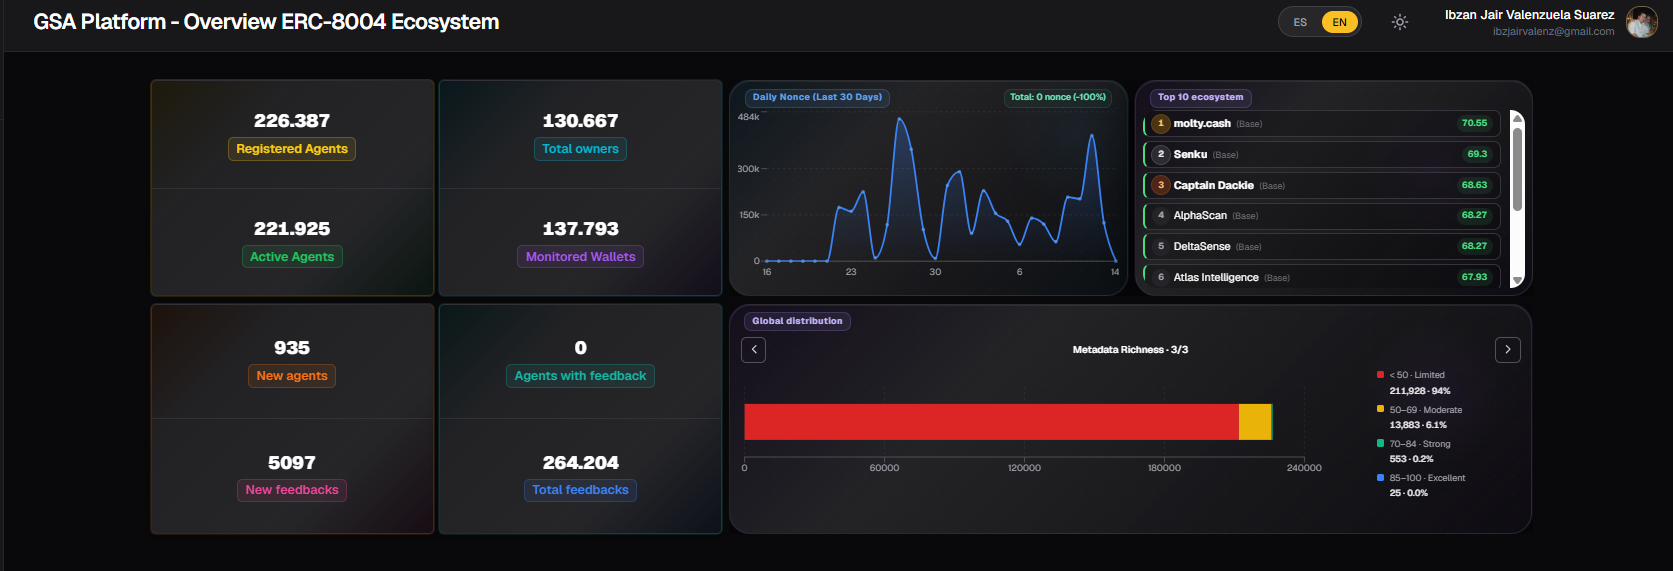
This section displays aggregated information from all monitored chains (BNB Chain, Arbitrum, Ethereum, Polygon, and Base).
Main KPIs
There are 8 key indicators that give you a quick overview of the ecosystem:
| Indicator | Meaning | Usage Tip |
|---|---|---|
| Agents Registered | Total number of agents registered on the platform | Useful to see overall ecosystem growth |
| Agents Active | Agents marked as active in their on-chain registration | Indicates how many agents are currently operational |
| Total Owners | Total number of wallets that own agents | Helps understand ownership distribution |
| Wallets Monitored | Wallets currently being actively monitored | Shows the reach of the monitoring system |
| New Agents | Agents newly registered on the blockchain the previous day | Measures daily registration pace |
| Agents with Feedback | Agents that have received at least one feedback | Shows how interactive the ecosystem is |
| New Feedbacks | New feedbacks registered on the blockchain the previous day | Indicates daily feedback activity |
| Total Feedbacks | Total number of feedbacks registered on the platform | Maturity metric of the ecosystem |
Daily Nonce (Last 30 Days)
Line chart showing daily agent activity (measured in Nonce) over the last 30 days.
Top 10 Agents in the Ecosystem
List of the 10 agents with the highest HUMI Index across the entire ecosystem.
Global Distribution Charts
Three charts showing how agents are distributed according to:
- HUMI Index
- WAMI Index
- Metadata Richness
4. Lower Section - Per Chain Summary
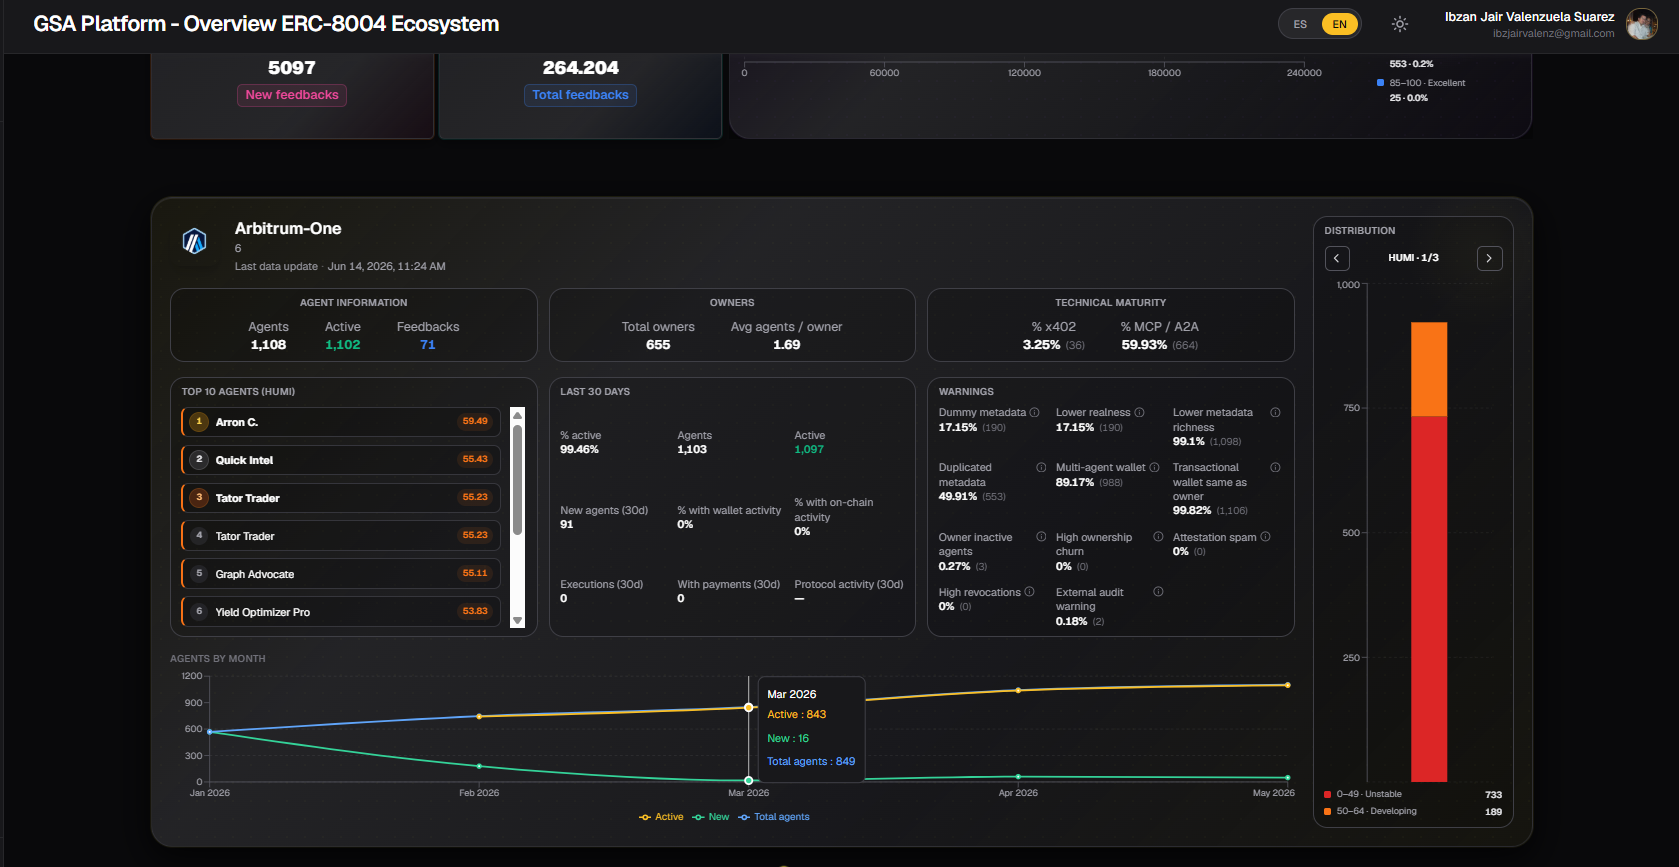
This section allows you to analyze each chain individually. You can switch between chains using the selector at the top of this section.
4.1 Agent Information
Basic data of agents on that chain:
- Agents: Total number of registered agents
- Active: Agents marked as active in their on-chain registration
- Feedbacks: Total number of feedbacks received
Tip: Compare active vs total agents to understand how "alive" the ecosystem is on that chain.
4.2 Owner Information
- Total owners: Total number of wallets that own agents
- Average agents / owner: Average number of agents per owner wallet
Tip: A high average may indicate concentration of agents in few wallets (possibly teams or large projects).
4.3 Technical Maturity
Percentage of agents supporting advanced technologies:
- % x402: Percentage of agents that support the x402 payment protocol
- % MCP / A2A: Percentage of agents compatible with Model Context Protocol or Agent-to-Agent
Tip: These percentages are good indicators of how technically advanced the agents on that chain are.
4.4 Top 10 Agents (by HUMI)
List of the 10 agents with the highest HUMI score on that specific chain.
Tip: Use it to quickly discover the best agents on a particular chain.
4.5 Agent Activity (Last 30 Days)
Recent activity statistics:
- % Active
- New agents (last 30 days)
- % with wallet activity
- % with on-chain activity
- Executions performed
- Payments made
- Protocol activity
Tip: This section is very useful to evaluate whether a chain has real usage or just agent registrations.
4.6 Agent Warning Rate
Breakdown of warnings detected on agents of that chain, such as:
- Metadata dummy
- Low authenticity
- Low metadata richness
- Duplicate metadata
- Multi-agent wallet
- Transactional wallet = owner
- Inactive agents from owner
- High ownership rotation
- Spam in attestations
- High revocations
- External audit alert
Tip: Review this section before interacting with agents from a new chain. A high percentage of certain warnings can be a red flag.
4.7 Index Distribution
Charts showing how agents on that chain are distributed according to:
- HUMI Index
- WAMI Index
- Metadata Richness
4.8 Agent Evolution (Line Chart)
Chart showing the historical evolution of agents on that specific chain, including:
- Total agents
- Active agents
- New agents
Tip: Observe the trend over the last months to understand if the chain is growing, stagnant, or declining.
General Usage Tips
- Use the Upper Section when you want a quick overview of the entire ecosystem.
- Go to the Lower Section when you need to analyze a specific chain in more depth.
- Combine the Top 10 HUMI with the distribution charts to find high-quality agents.
- Regularly check the Warnings section before interacting with agents from new chains.
- Use the sidebar to quickly access your favorite agents or recent searches.
Last updated: June 2026